B2B Insights

Learn How to Appropriately Use Data in Your Sales Outreach Emails

Lauren Daniels

May 5, 2026

Most sales emails are written with a clear objective, but far fewer are informed by evidence. The result is predictable. Messages are sent, inboxes remain quiet, and teams are left guessing what went wrong.

Sales outreach data changes that dynamic. It turns generic email blasts into targeted campaigns that prospects are more likely to engage with, rather than ignore.

Email remains one of the most widely used channels in B2B communication. Ninety-three percent of marketers rely on it for content distribution, while seventy-two percent of customers prefer it for business communication. Yet volume alone does not translate into effectiveness.

Using data in sales outreach emails means tracking the signals that shape better decisions. It informs how subject lines are written, when emails are sent, how messages are structured, and how follow-ups are timed.

This guide outlines which sales outreach data to track, how to apply it in practice, and which metrics have a measurable impact on revenue.

What Sales Outreach Data Means and Why It Matters

Sales outreach data refers to any measurable information that helps sales teams refine how they engage prospects. At its simplest, it includes familiar metrics such as open rates, click-through rates, response rates, conversion rates, and unsubscribe rates.

These indicators provide a surface-level view of performance, but their real value lies in what they reveal over time. Patterns begin to emerge. Certain subject lines consistently perform better. Specific segments respond more frequently. Some campaigns generate meaningful pipeline, while others fall flat.

Beyond these core metrics, sales outreach data can be used to calculate return on investment for individual campaigns, track progression through the pipeline, and evaluate internal execution. It answers questions that intuition alone cannot.

Most teams access this information through email platforms that track campaign activity automatically. For deeper analysis, tools such as website tracking and CRM integrations allow teams to connect outreach efforts directly to revenue outcomes.

The difference between guessing and knowing is not subtle. It is the difference between repeating the same mistakes and systematically improving performance.

How Sales Outreach Data Changes Campaign Performance

When applied properly, sales outreach data reshapes how campaigns are designed and executed.

Personalization becomes more precise. Instead of relying on assumptions, teams can use real data to understand a prospect’s role, priorities, and stage in the buying process. Messaging becomes more relevant as a result.

Open rates improve when subject lines are informed by past performance. Rather than relying on instinct, teams can identify which phrasing, tone, and structure consistently attract attention.

Response rates follow a similar pattern. Data highlights which email formats, value propositions, and calls to action generate replies. Over time, this allows teams to refine messaging into something far more effective than a generic template.

Sales cycles often shorten as well. When outreach is built on proven elements, prospects move through conversations with less friction. Follow-ups are better timed, messaging is clearer, and engagement builds more naturally.

At a broader level, data-driven sales outreach campaigns replace inconsistent execution with a more disciplined approach. This reduces wasted effort and protects sender reputation, both of which are critical for long-term performance.

The 5-Step Framework for Using Data in Sales Outreach Emails

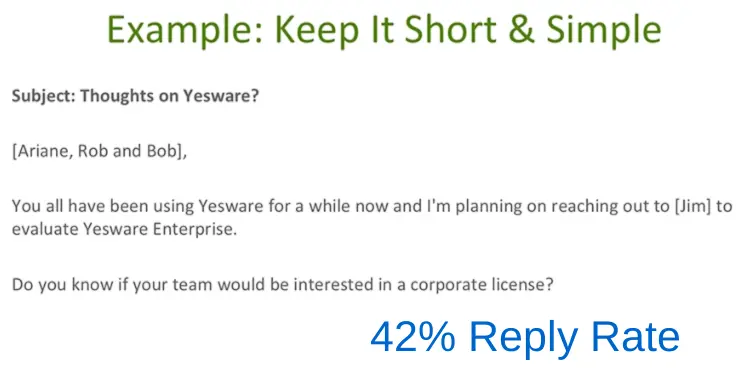
A structured approach makes it easier to translate data into action. Rather than treating each campaign as a fresh start, this framework builds on what has already proven effective.

Start with subject lines
Test multiple variations and track open rates to identify which ones consistently perform. Over time, this builds a clear picture of what resonates with your audience.

Develop adaptable templates
Use top-performing emails as a foundation, but keep them flexible. Strong templates provide structure while allowing room for relevant personalization based on each prospect.

Refine your calls to action
Small changes in phrasing can significantly impact response rates. Test different approaches and identify which ones consistently prompt engagement.

Optimise send timing
Experiment with different days and times, then analyse when your audience is most responsive. Patterns here are often more specific than expected.

Segment with intent
Group prospects based on meaningful criteria so messaging feels targeted rather than generic. This is where data has the most noticeable impact.

Essential Metrics Every Sales Team Should Track

Understanding which metrics matter is essential for making sense of your sales outreach data. Without a clear view of performance, it becomes difficult to distinguish between activity that feels productive and activity that drives real outcomes.

At a high level, sales outreach metrics should answer three questions: are your emails being seen, are they generating engagement, and are they contributing to pipeline. The following metrics sit at the centre of that analysis.

Visibility Metrics

These indicate whether your emails are reaching prospects and capturing initial attention.

  • Open rate reflects how effective your subject lines are and whether your emails are landing in the inbox rather than spam folders. For cold outreach, a typical benchmark falls between twenty-one and thirty-three percent. Consistently low open rates often point to issues with subject lines, deliverability, or list quality.

Engagement Metrics

Once an email is opened, the focus shifts to whether the content holds attention and encourages action.

  • Click-through rate measures how engaging your content is once the email is opened. Across industries, this generally sits between two and five percent. It provides insight into how compelling your messaging and links are.
  • Response rate is often the most revealing metric. It indicates whether your message is strong enough to start a conversation. Depending on targeting and relevance, this can range from one to ten per cent. High opens with low responses usually signal a disconnect between the subject line and message content.

Outcome Metrics

These connect outreach activity to tangible business results.

  • Conversion rate shows how many recipients take the desired action, whether that is booking a meeting or progressing to the next stage in the sales process. This is where outreach begins to translate into pipeline and revenue.
  • Unsubscribe rate acts as a warning signal. If it rises above half a percent, it often points to issues with relevance, targeting, or sending frequency. While often overlooked, it is a strong indicator of long-term list health.

Taken together, these metrics provide a clear view of what is working and where adjustments are needed. The real value, however, comes from tracking them over time. Trends reveal far more than isolated results, allowing teams to refine their approach with a level of precision that intuition alone cannot provide.

Personalization Strategies That Work Without Crossing the Line

Personalization is often misunderstood. More data does not always lead to better outcomes.

Effective personalization focuses on relevance rather than depth. Using basic information such as a prospect’s name, company, role, and industry is often sufficient to create a message that feels considered.

Referencing publicly available insights can add further context. Mentioning a recent company announcement or a piece of content they have shared signals genuine interest without feeling intrusive.

Problems arise when personalization becomes excessive. Overly detailed references can create discomfort and erode trust, particularly in early-stage outreach.

The balance is straightforward. Use data to make your message more relevant, but keep the tone natural. The goal is to start a conversation, not demonstrate how much information you have collected.

Timing Your Sales Outreach Based on Behavioral Data

When an email is sent, often matters as much as what it says.

Sending at the wrong time can result in your message being buried in an already crowded inbox. Even a well-written email may go unnoticed if it arrives outside of peak engagement hours.

There is no universal best time. Patterns vary by industry, role, and geography. The only reliable approach is to test and analyse your own data.

Historical campaign performance provides useful signals. Open and click patterns reveal when your audience is most active, allowing you to schedule emails more effectively.

Follow-up timing also benefits from structure. A sequence spaced across several touchpoints, for example, four days after the initial email, then seven, fourteen, and twenty-eight days, creates consistent visibility without overwhelming the prospect.

Automation can support this process, particularly when working across multiple time zones. Ensuring emails arrive during business hours increases the likelihood of engagement.

Building Follow-Up Sequences That Convert Using Historical Data

Follow-ups are often where deals are won or lost.

A single follow-up can significantly increase response rates, yet many sequences stop too early. Data consistently shows that most sales require multiple touchpoints before a meaningful interaction occurs.

Planning the sequence helps maintain consistency. It ensures that prospects are not overlooked and that messaging evolves with each interaction.

Historical data plays an important role here. By analysing which follow-ups generated responses in previous campaigns, teams can replicate effective approaches rather than starting from scratch.

Different angles can also be tested. Some follow-ups may introduce new insights, others may ask direct questions, and some may provide relevant examples or case studies.

Automation reduces the manual burden, but the content still needs to feel considered. The objective is to create a sequence that builds momentum, not one that feels repetitive.

Segmentation Tactics That Improve Targeting and Revenue

Segmentation is one of the most reliable ways to improve campaign performance.

Grouping prospects by geography allows messaging to reflect regional context. This can include market conditions, regulatory environments, or operational challenges.

Demographic segmentation focuses on characteristics such as role, company size, or industry. This helps align messaging with the priorities of different audiences.

Behavioral segmentation goes further by analysing how prospects interact with your business. Engagement patterns, past activity, and buying signals all provide valuable context.

The impact is significant. Campaigns that target segmented audiences generate a disproportionate share of revenue compared to broad outreach.

Combining multiple segmentation layers often produces the best results. When demographic and behavioral insights are used together, messaging becomes more precise and more effective.

Tools and Software for Tracking Sales Outreach Data

Technology plays a central role in collecting and applying sales outreach data.

Email platforms provide a baseline, offering visibility into opens, clicks, and conversions. Sales engagement tools extend this further by tracking activity across multiple channels.

Website analytics can reveal what happens after a prospect clicks through, providing insight into intent and interest.

CRM systems connect outreach activity to pipeline and revenue, allowing teams to measure the full impact of their campaigns.

Automation tools bring these elements together, ensuring consistent execution while capturing the data needed for ongoing improvement.

The Pre-Send Checklist for Data-Driven Outreach

Preparation has a direct impact on performance, but it is often rushed. A short, disciplined checklist helps ensure each campaign is set up to generate useful data and stronger results.

  • Engage with prospects on social platforms before outreach to build familiarity
  • Review past campaign performance to identify what has already worked
  • Set up tracking codes and attribution so results can be measured accurately
  • Map out your full follow-up sequence before sending the first email
  • Test emails across devices, especially mobile, to avoid formatting issues


Each step is simple, but skipping any of them reduces the effectiveness of your outreach and limits the quality of the insights you collect. Using data in sales outreach emails shifts the focus from assumption to evidence. It provides a clear view of what drives engagement and what does not.

The most valuable metrics are those that connect directly to outcomes. Open rates inform subject line effectiveness, response rates indicate message relevance, and conversion rates reveal commercial impact.

Strong campaigns combine this insight with thoughtful personalization. Prospects are treated as individuals, not entries in a database. Over time, consistent tracking builds a foundation for better decisions. Segmentation improves, timing becomes more precise, and messaging evolves.

Sales teams that adopt this approach tend to outperform those that rely on instinct alone. The difference is not incremental. It compounds over time.

For many teams, the challenge is not access to data. It is knowing how to apply it consistently across campaigns without slowing execution.

This is where structure matters. With the team at Whistle, data is not treated as a reporting layer added after the fact. It is built into how outreach is designed, tested, and refined from the start, so every campaign contributes to a clearer, more predictable pipeline.

If your outreach is generating activity but not enough meaningful conversations, it may be time to take a more strategic approach.

Not Sure Which Service Is Right for You?

Let’s figure it out together. Book a quick call and we’ll walk you through the best-fit options based on your goals, team structure, and current setup.
Latest posts

Demo content

Interviews, tips, guides, industry best practices, and news.
Office setting
Design
8 min read

UX review presentations

How do you create compelling presentations that wow your colleagues and impress your managers?
Read post
Man working at desk
Product
8 min read

Migrating to Linear 101

Linear helps streamline software projects, sprints, tasks, and bug tracking. Here’s how to get started.
Read post
Man pinning images on wall

Building your API Stack

The rise of RESTful APIs has been met by a rise in tools for creating, testing, and managing them.
Read post
Metric What It Measures Why It Matters Industry Benchmark
Open Rate Percentage of recipients who open your email Indicates subject line effectiveness and sender reputation 21-33% for cold outreach
Click-Through Rate Percentage of recipients who click links in your email Shows how engaging your content and CTAs are 2-5% across industries
Response Rate Percentage of recipients who reply to your email Measures actual engagement and conversation starts 1-10% depending on targeting
Conversion Rate Percentage of recipients who take the desired action Tracks the bottom-line business impact from campaigns Varies by offer and industry
Unsubscribe Rate Percentage of recipients who opt out after email Signals relevance issues or sending frequency problems