

Go-to-Market

Lauren Daniels
August 26, 2026

Almost every sales team has an ICP written down somewhere. Very few have turned it into something a rep can act on in the ten seconds after a lead lands in their queue.
The result is easy to spot once you know to look for it. Two reps open the same account and reach opposite conclusions. One chases it for three weeks. The other passes in five minutes. Neither decision was particularly informed, and both reps would defend their call.
That inconsistency is expensive. 67% of lost B2B sales stem from inadequate qualification rather than from bad products or pricing, and 67% of firms admit they do not consistently apply qualification criteria across their teams.
An ICP scoring model closes that gap by turning a description into a decision system. A weighted 0 to 100 score that every lead runs through, using the same criteria and producing the same output, no matter which rep happened to pick it up.
What follows is how to build one that survives contact with a real sales team: why most ICPs fail in practice, the three dimensions a scoring model needs, how to weight them using your own closed-won data, how to get it living in the CRM instead of a spreadsheet nobody opens, and the mistakes that kill adoption before the model has a chance to work.
A description is not a system. The gap between having an ICP written in a Notion doc and having reps use it to make daily prioritisation decisions is where most pipeline quality problems live. Three reasons that gap persists.
They are not measurable. "Mid-sized SaaS companies" is not a number. Two reps will define mid-sized differently and route the same lead in opposite directions, and both will believe they followed the ICP.
They are not consulted daily. The ICP usually lives in a slide from a strategy offsite. It has close to zero influence on the hundreds of small prioritisation decisions a sales team makes each week.
They are not tied to a clear action. A description tells a rep who the ideal customer is. An ICP scoring model tells them what to do with the lead sitting in front of them right now. Those are different jobs.
The performance difference is significant. Teams with a documented, scored ICP report 20 to 40% higher win rates and 15 to 30% shorter sales cycles compared to teams without one. The difference is the operationalised version of it.
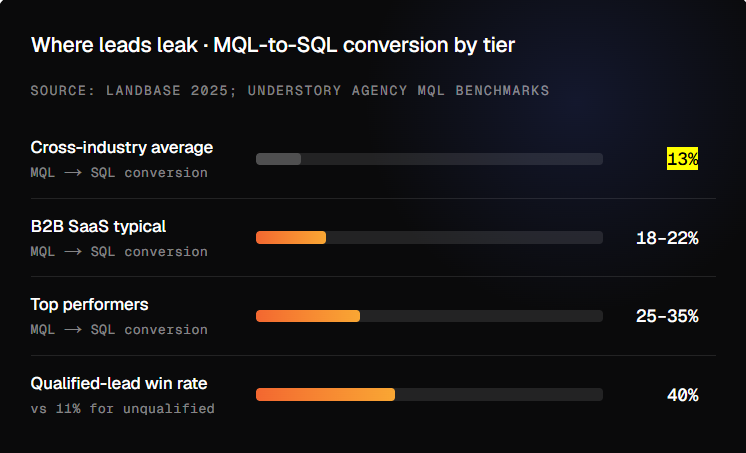
There is a volume argument too. The average MQL-to-SQL conversion rate sits near 13%, meaning roughly 87% of marketing-qualified leads never become sales-qualified. A scored ICP narrows that gap by making qualification consistent instead of rep-dependent.
Most models overweight the first dimension, because it is the easiest to pull from a database. The model only starts predicting deals when all three are present.
Does this company structurally look like your best customers, before anyone has spoken to them?
Fit covers firmographics: industry, company size, revenue range, funding stage, geography. It is cheap to evaluate and fast to score.
It also tells you almost nothing about whether the deal will close. Plenty of perfect-fit companies never buy anything.
That is why fit should be the largest single dimension without being the majority of the total score. An account should not be able to reach high priority on fit alone.
Does this company have the specific problem your product solves, and is there urgency to act on it now?
A company that looks ideal on paper but is not in pain yet will sit in "we're interested, let's revisit in Q3" indefinitely. The rep who keeps chasing it is doing so because the fit score looked good, not because there was ever a real buying signal.
What to evaluate here: urgency of the problem, severity of the pain, and whether the use case is a core workflow or a peripheral nice-to-have.
Need is the dimension most companies underweight. It is also the layer that most often separates a lead that closes from one that drags for a quarter and then goes cold.
Is this company acting like someone who has already started a buying process internally?
Multiple contacts from the same account visiting the pricing page. A demo request. A quick reply to outreach. Attendance at a relevant webinar. These are signals that a decision is forming, often before the sales team knows anything about it.
Behaviour is the timing layer. It tells reps not just whether an account fits and whether they are in pain, but whether right now is the moment to push.
Here is a starting template that holds across most B2B categories.
Fit earns the largest single share because structural misfit is a dealbreaker. There is no point in scoring need and behaviour for a company that was never going to buy.
Need earns more than behaviour because an account with genuine urgent pain and no observable signals yet is still a better bet than an account clicking email links without a real problem to solve.
Behaviour acts as a tiebreaker and a timing indicator. High behaviour from a mediocre-fit account is a distraction. High behaviour from a strong-fit account is the signal to move immediately.
Fit
Need
Behaviour
The ICP score is only useful if it maps to an action.
Generic weights give you a starting point. Your own pipeline history should shape the model that predicts which deals are most likely to move forward.
Step 1: Pull every closed-won deal from the last 12 months. For each one, capture industry, employee count, revenue range, funding stage, tech stack, the trigger that preceded the deal, decision-maker title, ACV, and time to close.
Step 2: Sort by ACV and retention, rather than deal count. Your true ICP is the top quartile by ACV with the lowest churn. The median customer includes every compromise you made when you needed revenue that quarter. Build around the top quartile, not the average.
Step 3: Find the shared characteristics. Three or more overlapping traits across industry, size, stage, and tech stack become your scoring criteria. Traits appearing in fewer than half your top-quartile accounts are noise. Exclude them.
Step 4: Validate against closed-lost. If closed-lost accounts share the same firmographic profile as closed-won accounts, the rubric is missing a differentiating layer. Add technographic or trigger criteria until the two cohorts look meaningfully different.
Step 5: Translate traits into point values. Assign points within each dimension based on how strongly each factor predicted closed-won. If Series B accounts closed at twice the rate of Seed accounts in your pipeline, Series B earns proportionally more points on fit.
Step 6: Run the model against historical pipeline before going live. Verify that scores correlate with actual outcomes before anyone uses them for live prioritisation. If a batch of 40-point accounts closed and a batch of 80-point accounts did not, the weights need recalibration.
That last step is the one teams skip, and it is the one that protects credibility. A model that misroutes accounts in its first month will not get a second chance with the sales team.
A scoring model that lives in a spreadsheet is a document one person updates, and nobody reads.
Operationalising it looks like this in practice.
Add an ICP Score field. A numeric 0 to 100 field on the Account object in HubSpot or Salesforce.
Populate it through enrichment. Tools such as Clay, Apollo, or Clearbit can update the score automatically as firmographic or technographic data changes.
Recalculate on every data update. Build a workflow that refreshes the score whenever enrichment data changes. Stale scores are as harmful as no scores, because they route reps confidently towards the wrong accounts.
Put the score where reps already look. Make it visible on the Account detail view without requiring navigation into a sub-tab. Friction in the UI kills adoption faster than any training programme ever fixes it.
Build routing off the score. Accounts above 75 get added automatically to priority sequences. Accounts between 50 and 74 enter a nurture track. Accounts below 50 get deprioritised unless a behavioural override fires.
There is a wider productivity case for doing this properly. Companies with well-integrated go-to-market tech stacks are approximately 42% more likely to lift sales rep productivity. The argument for building ICP scoring into the CRM rather than a spreadsheet is the same.

Making it too complex. If scoring a lead takes more than two to three minutes, reps will skip it for obviously good leads and forget it for ambiguous ones. Those ambiguous leads are exactly what the model was built to help with. Keep the criteria to things a rep can fill in from memory right after a call.
Firmographics only. Industry and size predict who might buy. Technographic and trigger layers predict when. A model built on static data alone will keep scoring accounts that look excellent and never move.
Built once, never updated. Review the model quarterly and compare conversion rates across score tiers. It is the only way to know whether it still predicts deals or whether it is scoring for a version of your business that no longer exists. Major updates are needed when you enter new markets, launch new products, or see a significant shift in your customer base.
No negative ICP. Defining who is not your ideal customer matters as much as defining who is. Industries that churn at twice the average rate should actively disqualify accounts, not simply score them low. Company sizes that never expand past the initial contract are not worth the acquisition cost regardless of how their fit score reads.
Not enforcing it. If reps can move a lead to the next pipeline stage without entering a score, most of them will. Making the score a required field before stage progression is more work than scoring it, which is precisely the kind of structural nudge that produces consistent use.
An ICP scoring model earns its keep when the outreach behind it is reaching verified contacts at the right accounts, at the right level of seniority, across enough touches to generate a response.
The model tells your team which accounts to prioritise. The outbound motion determines whether those accounts ever hear from you.
Whistle's SDRs work from ICP-matched, verified contact data across coordinated email, phone, and LinkedIn sequences, reaching the accounts your scoring model surfaces before a competitor gets there first.
If your team has an ICP but is still qualifying on instinct rather than data, it is worth talking through what a scored, structured outbound programme would look like against your specific pipeline.
What is an ICP scoring model?
It is a weighted 0 to 100 system that scores every account against the same criteria and produces the same output regardless of which rep evaluates it. It converts a written ideal customer profile into a decision a rep can act on immediately, scoring across fit, need, and behaviour.
What is the difference between ICP scoring and lead scoring?
ICP scoring evaluates whether an account structurally belongs in your pipeline, using fit, need, and behaviour together. The fit and need dimensions assess the company itself rather than individual engagement activity, while behaviour adds the timing layer that indicates whether a buying process has already started internally.
How do I weight the dimensions in an ICP scoring model?
A workable starting template is 40% fit, 35% need, and 25% behaviour. Fit takes the largest share because structural misfit is a dealbreaker, need outranks behaviour because urgent pain beats idle clicking, and behaviour serves as a tiebreaker and timing indicator. Recalibrate those weights against your own closed-won data rather than treating them as fixed.
What score threshold should trigger priority outbound?
75 and above routes immediately to AEs for personalised, high-touch outreach. Accounts scoring 50 to 74 enter an SDR sequence with moderately personalised outreach. Below 50 get deprioritised or excluded from outbound unless a strong behavioural signal overrides.
How often should an ICP scoring model be updated?
Review it quarterly, comparing conversion rates across score tiers to confirm it is still predicting outcomes. Run a larger update when entering new markets, launching new products, or when the customer base shifts significantly.
What happens when a low-scoring account shows strong behavioural signals?
Behavioural signals can overrid a low score and pull the account back into outbound. Apply that override carefully, though. High behaviour from a mediocre-fit account is usually a distraction, while high behaviour from a strong-fit account is the signal to move immediately.
How do I get my sales team to actually use the ICP scoring model?
Keep scoring under two to three minutes, put the score where reps already work rather than behind a sub-tab, and build routing so the score does something visible. Then enforce it structurally by making the score a required field before a lead can progress to the next pipeline stage.



%20.jpg)

.jpg)
%20.jpg)